
Residence Time Distribution Measurement & Automated Evaluation with ExtruVis
ExtruVis is a plug-and-play instrument to measure Residence Time Distribution (RTD) in any possible application in which a visual tracer can be applied. After adding the tracer, ExtruVis records a video of the experiment. Once the measurement is completed, ExtruVis evaluates the RTD automatically.
In addition to automated RTD evaluation, the latest ExtruVis software version offers enhanced data visualization and analysis features, making RTD interpretation faster and more intuitive than ever before.
How ExtruVis Works
ExtruVis is a complete solution for carefree measurement of residence time distributions. Everything you need is included and packed into a robust and easy to transport trolley. Take it directly to the processing equipment and follow the four steps below to obtain the RTD insights.

Step 1: Setup
Use the versatile tripod to place the ExtruVis camera in the vicinity of the process. Turn on the ring light, object the field of view, and set the camera parameters.

Step 2: Adding the Tracer
Start the measurement on the laptop. A 10 second countdown enables a single researcher to start the measurement and add the tracer. The time point is signalled by an acoustic beep.
Step 3: Real Time Measurement
ExtruVis records the color information of the ROI (Region Of Interest). Multiple regions of interest (ROIs) can now be measured simultaneously within one experiment, allowing parallel monitoring of different outlet zones or process sections.

The integrated status bar summarizes the current experiment’s characteristics at a glance, ensuring full transparency during the measurement.

A new color gradient visualization provides intuitive insight into the tracer progression, supporting quick interpretation of mixing behavior directly during the experiment and enables a precise and reliable determination when the tracer is washed out.
Step 4: Analyze Your Data
ExtruVis guides you through the analysis of the recorded measurement and gives you access to results within seconds. A live evaluation window allows for immediate assessment of key RTD parameters, while maintaining full access to advanced analytical and model-based evaluation.
Measurements can now be directly compared within the application. Residence time distributions (RTDs) and calculated parameters from two experiments can be overlaid and evaluated side by side, making process optimization and scale comparison even more efficient.

Export your results effortlessly for documentation or advanced analysis. As soon as the evaluation is complete, ExtruVis is ready for the next RTD measurement (back to step 2).
The Benefits of ExtruVis Residence Time Distribution Measurement
Standardized Solution for All Scales
Before ExtruVis, there was no standard way to measure residence time distribution (RTD). With ExtruVis, you can rely on reproducible data based on quantitative measurements and compare the RTDs of processes on different scales, now even more conveniently with direct in-app comparison of two measurements.
Plug & Play Technology
There is no calibration or software installation needed. Everything comes ready to use in a trolley with a lifetime license included. Perfect for troubleshooting during process evaluation.
Defined Shadow-free Light Source
The unique ExtruVis LED ring-light circularly mounted on the camera decouples the light conditions of the process under investigation from ambient light sources (e.g. ceiling lamp, sun, etc.). This makes the results reproducible and independent of ambient lighting conditions.
Real-time Data Evaluation
During the measurement, you can follow a live chart on your laptop showing all the relevant data. The color gradient display enhances visual interpretation, while the status bar keeps all key experiment parameters visible. The evaluation is completed within seconds and stored as a .xlsx file.
Better Than the Naked Eye
ExtruVis is superior to the human eye and a reliable way to obtain accurate RTD results. Time points like peak and washed-out time are important for constructing RTDs but lie in regions of subtle changes and cannot be determined precisely with the stopwatch approach.

Is ExtruVis Difficult to Use?
ExtruVis Requires No Training
ExtruVis is a very simple plug and play system that empowers the operator to describe the color information in a quantitative manner in real time. The start and end point of the RTD experiment are determined precisely. The evaluation is performed by a sophisticated algorithm, which ensures reproducible results after a few clicks.
Simulator Included to Build Confidence and Practice
We understand that the operation of an instrument must be learned before it can be used with confidence. We included an RTD simulator for gaining the confidence before you run an expensive experiment.


RTD simulation printed color bars
The ExtruVis system contains a laptop with the ExtruVis software preinstalled. It is easy to use, gives you quick results from one experiment, and allows raw data export for advanced evaluation. The simulator is a programmable rotating cylinder with a printed color gradient and mimics the outlet of a continuous process.
What Results Can You Expect from ExtruVis?
A picture is worth a thousand words. This is true for RTD measurements. The RTD curves tell you more than single values. RTDs are usually evaluated either via curve evaluation or model-based evaluation. Both methods create data that can be used as a tool for process design or troubleshooting.
Analytical Curve Evaluation
The analytical evaluation of the parameters is performed by statistical curve evaluation, which describes the shape and dimensions of the parameters based on analytical measurements.

For simplicity‘s sake, standardized measurement parameters are defined to make them quickly comparable with tmean. For in-depth analysis, a complete overlapping is recommend.

A slight change, which is not detectable by the naked eye, is reliably detected by ExtruVis, revealing a flow error like a bypass stream.
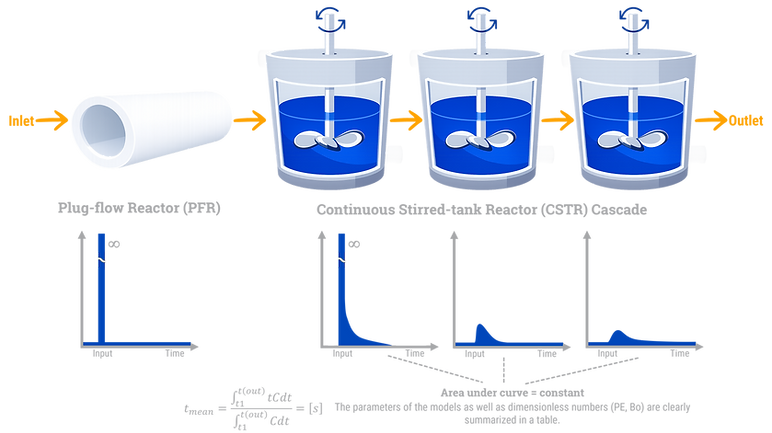
Model-based Evaluation
The combination of ideal models can be used to represent real processes. ExtruVis uses a series of plug flow reactors and continuously stirred tank reactors to represent the measured data.
Plug flow fraction: The fluid that does enter the reactor system flows in plug flow.
Number of continuous stirred-tank reactors (CSTRs): The parameter n is the number of CSTRs in series used for the model to describe the experimental measured RTD.
Dead zone fraction parameter: The dead zone fraction parameter d describes the fraction in the process where no mixing and no conveying occurs.
But there are many more values like the Back Mixing Quality, Bodenstein number, and Peclet number.
What Are the Core Components of ExtruVis?
We believe that simplicity is the key to efficiency. That’s why ExtruVis technology comes as an all-around carefree package packed in a handy trolley. It contains all the necessary equipment needed to measure the RTD.
Combined Camera & Light Unit
The unit consists of a USB camera and a ring-light. The circular light provides a uniform, reflection- and shadow-free illumination of the region of interest (ROI). Precise color measurement guaranteed.

The camera lens is suitable for RTD measurements on all scales. Two configurations allow measurements from a lab (mm² range) to production scale (cm² range).
High-pigmented Tracer
High-pigmented tracers in RGB (red, green, and blue) are included. The tracers are thermally stable single molecule food grade colors. Other tracers are possible if they give enough visual response at the outlet.

Only very small amounts are needed for the experiments. A rule of thumb for the tracer amount is to take 1-3% of the mass flow that enters per second.
Versatile Tripod Enabling Any View
The tripod allows various mounting options and can be adjusted in several versatile ways.
